
Open any social analytics tool and it will offer you twenty-five metrics. Almost none of them will change what you do on Monday morning, which is the only test a metric has to pass.
The useful set is small. Six numbers, reviewed weekly, will tell you whether an account is growing, whether the growth is real, and which of your posts to make more of. Everything else is either a lagging restatement of one of the six or a vanity number that moves for reasons you cannot act on.
The six
1. Reach from non-followers
The most important number on the list, and the one most dashboards bury. It is the only direct measure of whether the platform is showing your content to new people, which is the entire mechanism of organic growth.
When it moves: up means distribution is working and the content is landing with a cold audience. Down, while follower reach holds, is the classic suppression signature. See how to tell a shadowban from everything else. Down alongside follower reach is a content problem.
2. Watch-through in the first three seconds
For short video, this single number explains more variance in reach than everything else combined. The platform decides how widely to push a clip largely on whether people stay past the opening.
When it moves: a drop almost always traces to a change in how posts open: a new intro card, a slower first beat, a hook that arrives at second four instead of second one. This is the most directly fixable metric on the list.
3. Saves and shares per thousand views
Deliberately paired, and deliberately per-thousand rather than absolute. Likes are cheap and correlate with almost nothing. A save is somebody saying they want this later; a share is somebody spending their own social capital on it. Both weigh heavily in distribution and both are hard to fake.
When it moves: up means the content has utility or emotional weight beyond the scroll. This is the metric to optimise if reach is fine but growth is flat.
4. Follower growth rate, as a percentage
As a percentage, not a count, because 300 new followers means something completely different at 2,000 followers than at 200,000.
What normal looks like: one to two percent a month is the industry-average band for an established organic account. Sustained growth above five percent a month is genuinely strong. A sudden spike with no corresponding rise in reach is worth investigating rather than celebrating. It usually means bought followers, whether you bought them or not.
5. Profile visits to follow rate
Of the people who reached your profile, how many followed. This isolates the profile itself (the picture, the bio, the first row of the grid) from the content that sent them there.
When it moves: a low rate with healthy reach means the content is working and the profile is not converting. It is the cheapest thing on this list to fix, and the most commonly neglected, because it needs an afternoon rather than an ongoing effort.
6. Outbound clicks, where the account has a destination
For any account whose purpose is to send people somewhere, this is the one that ties the work to an outcome. Everything above it is intermediate.
What normal looks like: click-through above one percent of reach is solid for most niches. Below that, either the call to action is not being made or the audience is not the one you want.
What to ignore, and why
- Impressions. Counts the same person twice. Reach answers the question you actually have.
- Total likes. Cheap, weakly weighted in distribution, and moves with reach anyway, so it tells you nothing reach has not already told you.
- Follower count as a headline. A stock, not a flow. The growth rate is the number that describes this week.
- Best time to post. Derived from your existing audience's habits, which is circular. Post consistently and the audience adapts.
- Engagement rate, unqualified. Defined four different ways by four different tools, so it is not comparable to anything, including your own past numbers if you changed tools.
The cadence that makes it work
Weekly, not daily and not monthly, and the reason is specific to how these numbers behave.
Daily is noise. A single post can move any of the six by a large margin, and reacting to it means changing strategy on a sample size of one, which is how accounts end up with no identity at all.
Monthly is too slow. A reach problem caught in week one is a two-week recovery; the same problem caught in week five has had a month to train the distribution system on poor performance, and that takes considerably longer to undo.
A weekly review that takes fifteen minutes per account: the six numbers against the previous four weeks, the best and worst post, and one decision. Not a report. A decision. If the review does not change what gets made next week, it was a status update.
Comparing accounts without lying to yourself
Agencies running many accounts inevitably want one table with all of them in it, and the table is usually misleading, because the accounts are at different sizes and different ages.
Two adjustments fix most of it. Use rates rather than counts everywhere: reach per follower, saves per thousand views, growth as a percentage. And group accounts into size bands before comparing, because a 3,000-follower account and a 300,000-follower account have almost nothing in common mechanically.
Once that is in place the table becomes genuinely useful for the one question it should answer: which accounts are underperforming their band, and therefore where an hour of attention is worth most. Pulling those numbers together across a fleet, per account and per person, is one of the things ALI is built to make routine rather than a monthly export exercise.
Common questions
What is a good follower growth rate on Instagram?
One to two percent a month is the industry-average band for an established organic account. Sustained growth above five percent a month is strong. New accounts under a few thousand followers routinely exceed both, which is a property of small numbers rather than a sign of exceptional performance.
Should I track engagement rate?
Not as a headline number. Different tools define it against reach, against impressions, or against follower count, so it is not comparable across tools or even across time if you switch. Saves and shares per thousand views answer the same question, namely whether the content is worth something to people, and are defined the same way everywhere.
How often should I review social media metrics?
Weekly. Daily review reacts to single-post noise and produces incoherent strategy. Monthly review catches problems about a month after they became fixable. Fifteen minutes per account per week, ending in one decision about what to make next week, is the useful shape.
Which single metric matters most for organic growth?
Reach from non-followers. It is the only direct measure of whether the platform is putting your content in front of new people, which is the whole mechanism of organic growth. Every other metric on the list either feeds into it or describes what happens after it.
Keep reading
 7 min read
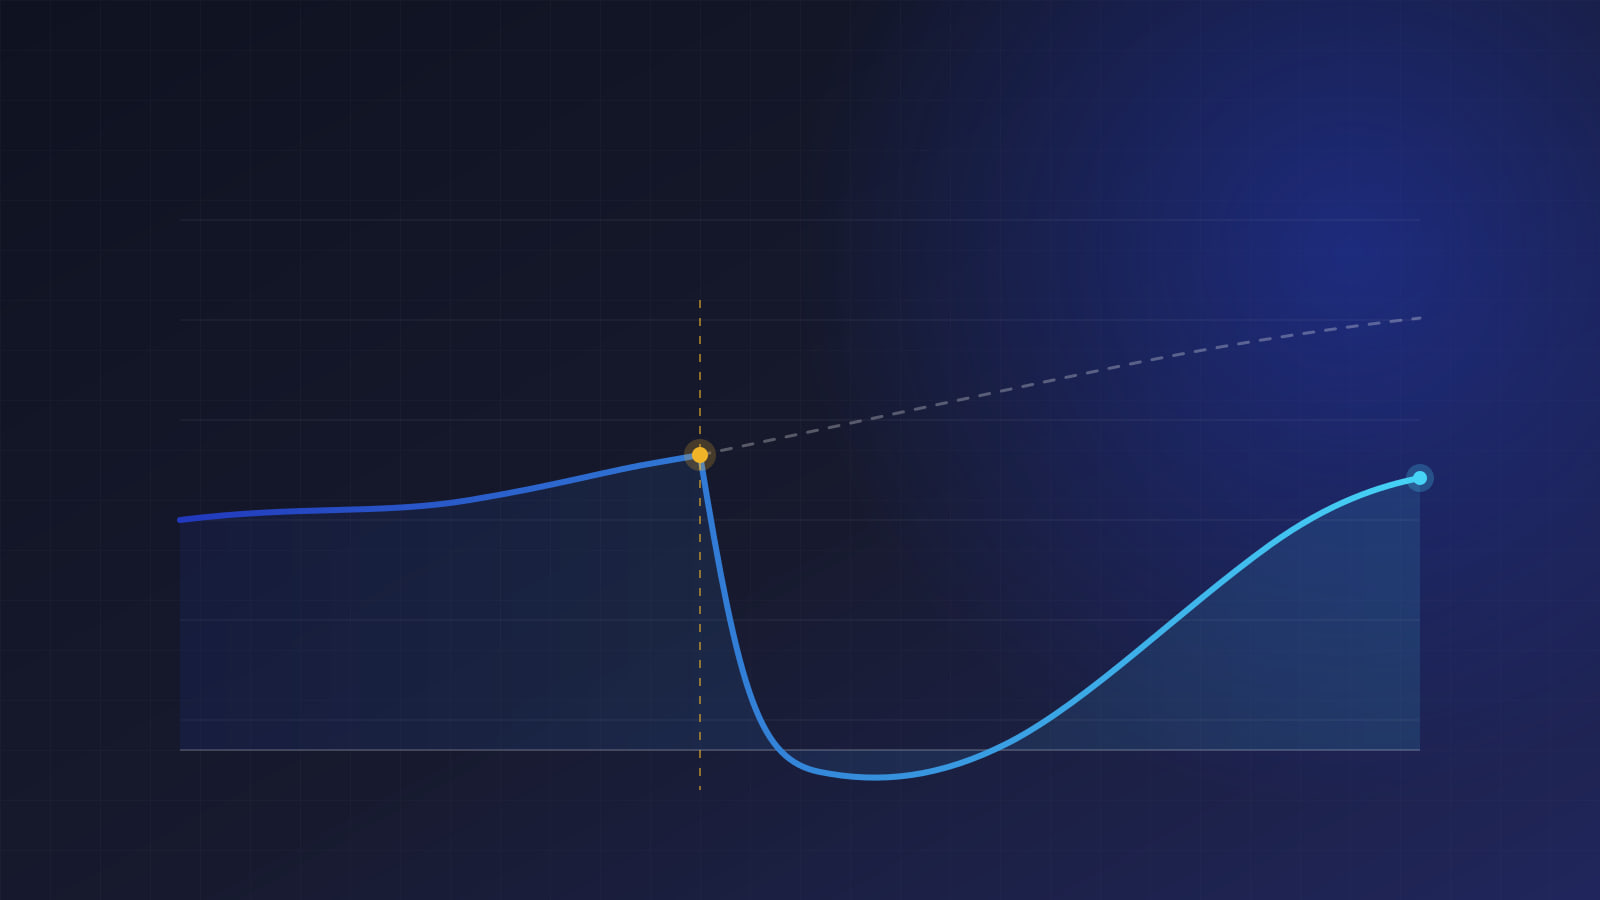
Reach Fell Off a Cliff: How to Tell a Shadowban From Everything Else
A reach collapse has four common causes and only one of them is suppression. Treating all four the same way is why so many accounts never recover. Here is how to tell them apart in an afternoon.
Read the article 7 min read
The Content Workflow That Survives Your Eleventh Account
Almost every agency hits the same wall between the third account and the fifteenth. The work does not get harder. The coordination does. Here is the shape of a pipeline that holds.
Read the article 8 min read
How to Manage Multiple Instagram Accounts Without Getting Them Flagged
Running several accounts is not against the rules. Running them badly is what gets them restricted. Here is what actually links accounts together, and how to structure things so one problem stays one problem.
Read the article